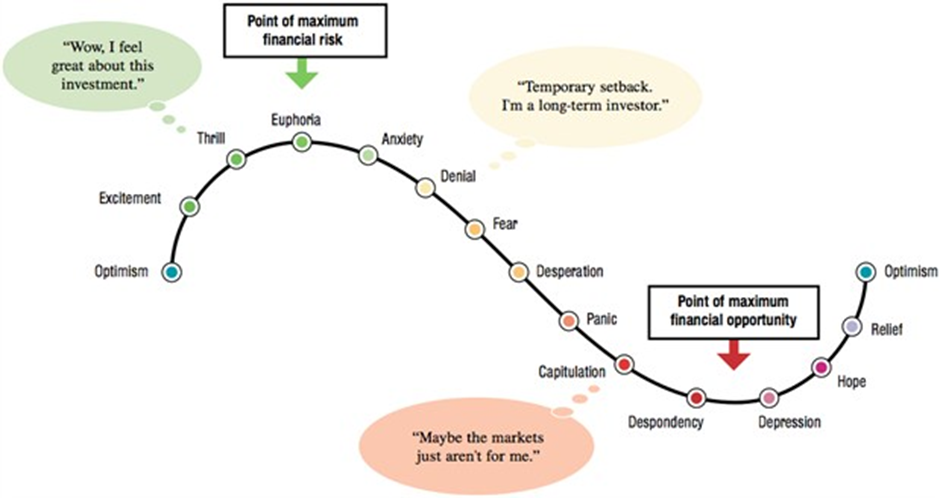
If you read Alex’s article on the 10 deep value China stocks, you would have come across the diagram where he mentions that the change in sentiment could mean that we are now at a hope/relief stage amongst Chinese listed stocks.
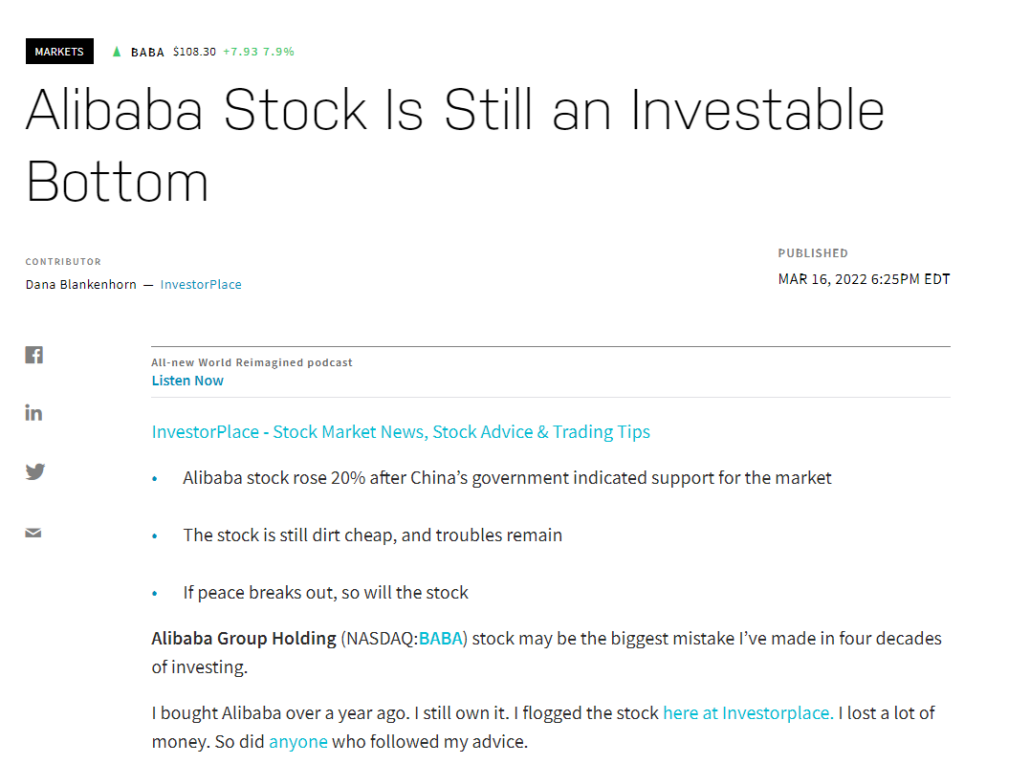
A historical rally happened this week, and its impact on Alibaba was significant. Many investors who have been holding or buying the dips on Alibaba are finally getting a break after what felt like an endless tumble since late 2020.
The question now is what do we do from here?
What Technical Analysis says about Alibaba now
In my opinion, the market has taken an almost instantaneous shift in sentiment towards Alibaba almost overnight! With such a robust bullish reversal, I conclude that we are now trading more on momentum than anything else.
Here are some of my thoughts on how the chart is forming up:
Price Action – Support & Resistance
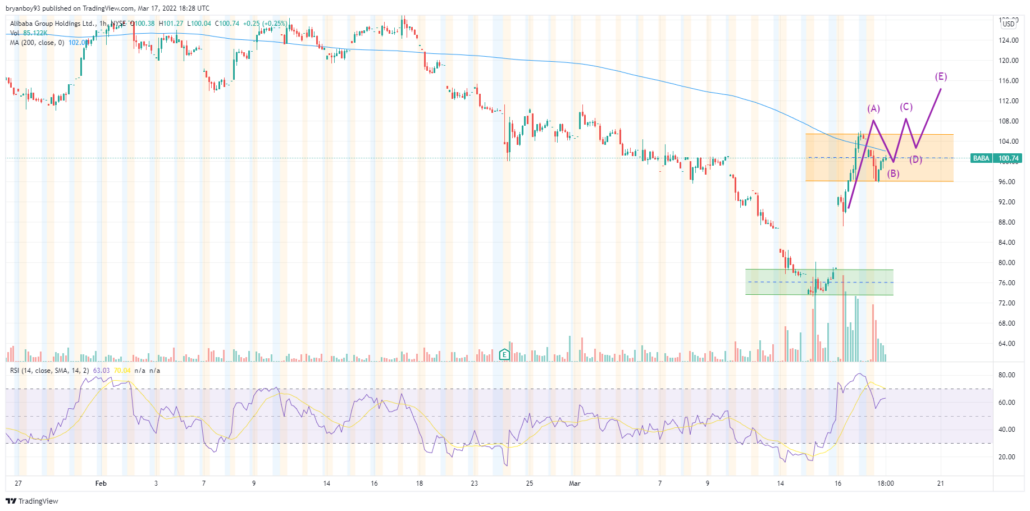
Based on the 1-hour chart and it is clear that support is strong at $70-75 (Indicated in Green). This is an extremely crucial support level and I do hope that we do not test this level again. If we do find ourselves trading at this level again, this may potentially be a zone where traders may want to set their stop-losses to control their risk.
Although we are seeing a distinct reversal in the bearish momentum, should we break below this support zone again, it is likely that the bear market would continue.
In my opinion, for this bullish trend to continue, it is vital that the price action HOLDS at $100. This is extremely important now more than ever as we are trading on momentum. This means that for traders, $100 would be an area where they would want to take profit and for others, it may be an area where they want to go long. We can already see the range forming between $95 and $105 (Indicated in Orange).
Wishful thinking or not, a more convincing bullish continuation pattern would be the one which I indicated in Purple where we see the price action form a support at $100 before moving upwards.
RSI & MACD – Indicators of Momentum
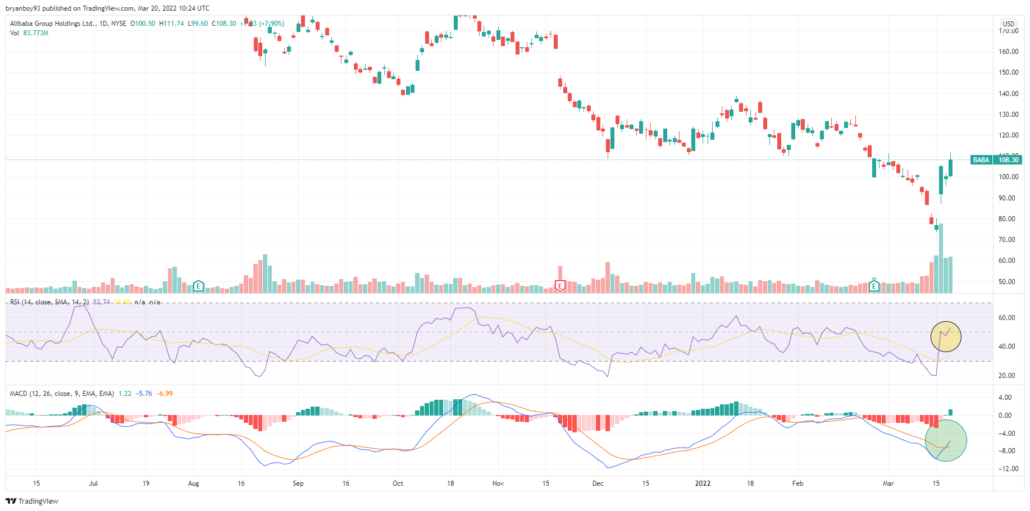
Based on the RSI and MACD, I’d say that investors can heave a sigh of relief for now as both indicators are showing signs of a “pause” in this bear market.
In the case of the RSI (Yellow Circle), what we want to see is this indicator head upwards and to break and hold above the dotted line. At the very least, this would indicate that the stock has found renewed strength in its momentum.
The MACD is also showing signs of a reversal (Green Circle). Not to go too deep into things but a rally usually follows when the blue line breaks above the orange line.
Dead cat bounce?
In my opinion, the charts do indicate that relief is underway. At the very least, distinct support levels have formed once again and for investors who want to control their risks, the stop-loss levels couldn’t be clearer.
Unfortunately, this is the market and with all its volatility, for all we know, we might wake up to another horrifying trading week. However, what’s important here is that I strongly believe this signals that the underlying sentiment towards China stocks has indeed changed. This adds even more conviction to what I see above in the charts.
P.S. if you’re looking to invest in China stocks, join Alvin as he shares how he continues to find strong China growth stocks in the current climate.