To date, there are over 20 technical indicators which technical traders use to guide their decisions. Such indicators often have complex mathematical formulas behind them and in the past, these indicators would have had to be manually formulated.
However, as modern day traders, we now have computers to crunch these numbers for us and as such, most brokerage platforms are able to display these indicators with just a press of a button.
While some indicators are more popular than others, it is important to understand that technical indicators should never be used in isolation. Instead they should always be used in comparison with other indicators, preferably also with basic concepts of fundamental analysis.
Update! I’ve shared my latest workflow here:
Technical Indicator 1 : Simple Moving Average – 50 day and 200 day
A foundation for most technical indicators, the simple moving average (SMA) helps traders to smoothen the price data of a stock over a period of time. This gives traders a clearer idea of the direction that a stock is heading.
While the formula to calculate a moving average can vary, it is important to note that the number associated with the moving average defines the time period that the moving average has been calculated upon. Therefore, a 50 day SMA essentially shows you the average price of a stock within the time frame of 50 days.
There are no time frames that are considered the “best”. Instead, the 50 day SMA has become widely accepted as moving average that best indicates the short-term direction of a stock price. Likewise we have the 200 day SMA which is generally accepted as a reliable indicator for longer term trends.
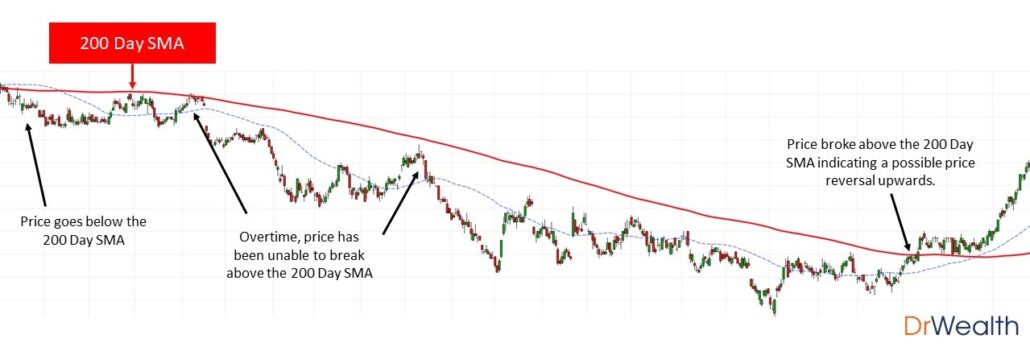
Used on its own, the moving average can tell us where the direction of a stock price is headed in the short term (50 days) and the long term (200 days). At its most basic level of understanding, when the price of a stock has broken below the 200 Day SMA, it is an indication that the stock is currently bearish.
Likewise, when price action has broken above the 200 day SMA, this can be seen as a possible price reversal upwards:
Though the simple moving average can be used on its own, there are other more complex signals that technical traders look out for which indicate a higher amount of conviction with regard to market sentiment and price trends.
Such signals include the divergence or convergence of the 50 day SMA and the 200 day SMA. These signals constitute a deeper level of understanding of the SMA.
Technical Indicator 2 : Moving Average Convergence Divergence (MACD)
Building on the foundations of the SMA, the MACD is a tool to measure the rate of price change over a period of time. On the MACD indicator itself, there are multiple strategies which traders can use to guide their trades. Of these strategies, one of the most basic interpretations is to look at the relationship between the MACD Line and the SIGNAL line.
In the diagram below, the MACD Line is indicated in Brown and the SIGNAL Line is indicated in Blue

It is important to note that when these two lines converge on each other in the indicator, it is usually an indication of an impending upward or downward move.
I’ve found the MACD to be more accurate when it is applied on the Weekly Chart or the 3 Day chart.
Author’s Tip for the MACD
Technical Indicator 3 : Relative Strength Index (RSI)
Another common indicator used by traders, the Relative Strength Index (RSI) indicates when a stock is oversold or overbought.
By definition, an oversold stock refers to a stock that’s currently trading at a low price and may experience a reversal in the short term. Conversely, an overbought stock refers to the price of a stock being too high (possibly too fast) therefore increasing its chances of a downward correction in future.
By and large, the RSI is able to indicate such signals through a series of formulas based on how quickly the price movement of a stock occurs. With modern day technology, these formulas are now calculated for us and is displayed on the RSI indicator as a range of between 0 and 100.
It is generally accepted that a stock is oversold or overbought if it meets the following conditions on the RSI,
- Oversold – RSI is below 30
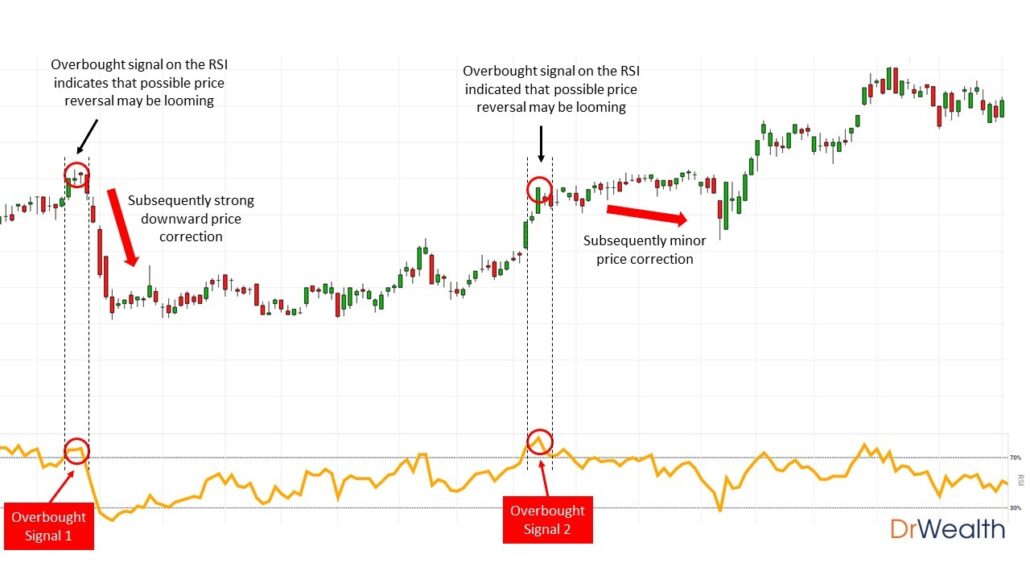
- Overbought – RSI is above 70
With these conditions as a guide, it is safe to conclude that you may not want to enter a position in a stock if it is currently or near overbought signals. Let’s take a look at an example of how stocks which are currently overbought may experience a price reversal downwards.
Likewise, using the same chart, we have an example of how an oversold stock can experience a price reversal upwards.
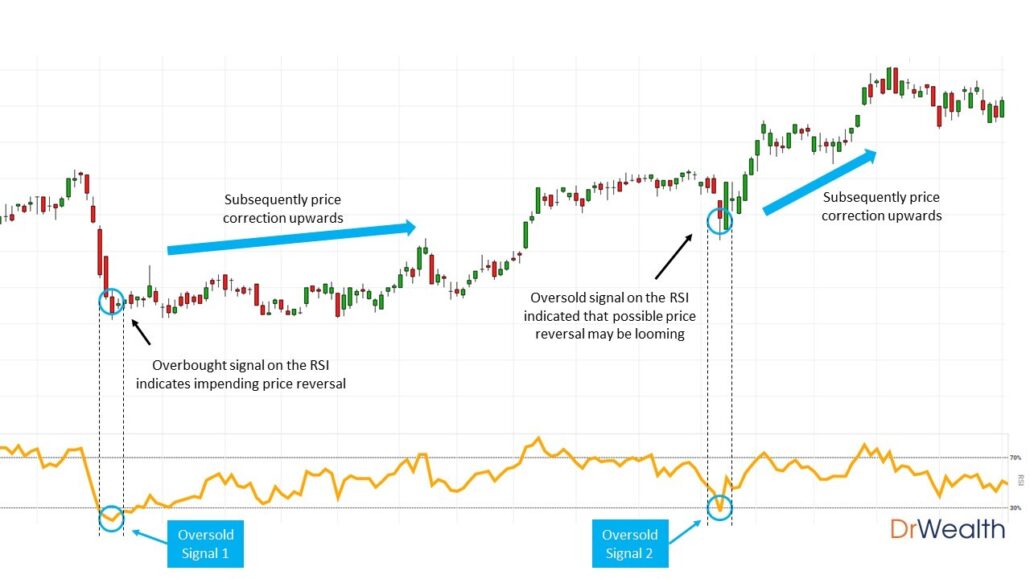
The 2 diagrams above illustrate very basic examples of how investors can make better decisions on the entry and exit points of a stock using the RSI indicators.
However, if we look deeper into both diagrams, we notice that while the stock has had its overbought and oversold points, the momentum of its price upwards or downwards have had largely varying intensities. Such period of intense price moment can be known as “swings”.
This indicator is also useful if you’re looking to trade cryptocurrencies.
I hope you have found the three technical indicators I’ve shared useful in helping you time your trades better. If you’d like a framework that can help you trade better using momentum, join Alvin at his next webinar.