Welcome to the bear markets.
Now that Bitcoin has fallen below US$25k, everyone is trying to call the bottom. And, investors who had missed the previous run may be wondering if its time to “buy the dip”.
Well, easier said than done, how do we know this is “the dip”?!
Or, will it keep on dipping?
In this article, I’ve compiled free resources that could help you determine if now is a good time to buy Bitcoin and to hopefully identify the “dip”?
But first:
Are these resources trustworthy?
All of the resources mentioned here rely on publicly available transaction information recorded on the blockchain.
You see, the blockchain is an open ledger aka a publicly available record book.
Having all transactions available publicly helps to level out the playing field for retail investors like you and me – no need to wrap our heads over convoluted market charts or overpay for ‘premium’ data! Although past data won’t guarantee future results, it helps us to understand investors behaviour and spot patterns that could help us make better decisions.
That said, if you were to try to go through all the entire blockchain since its inception, it’s not going to be easy.
So, here’s another good news: there are freely available data sets that we can use! I’ll share 3 of them below.
3 ways to determine if ‘now’ is the best time to buy Bitcoin
Quick note, the crypto markets are moving fairly quickly. I’ve link to all the live charts below, do check them out for the latest data!
1) MVRV Ratio
Market Value to Realised Value (MVRV) Ratio = Market Cap / Realised Cap
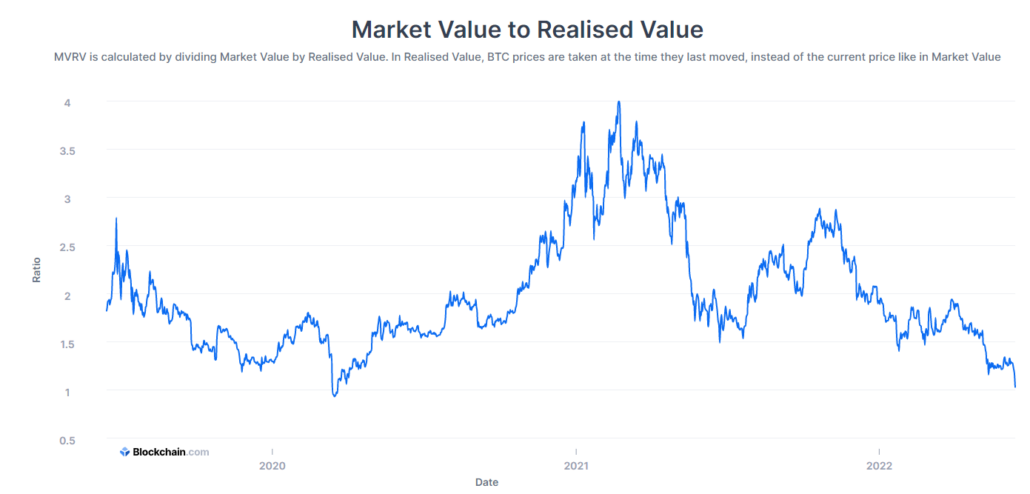
This is loosely similar to the growth investor’s Price to Sales (PS) ratio.
Here, the market cap is the total market value of Bitcoin (price of BTC * total no. of coins in circulation) while Realised cap is an approximation of the value paid for all the coins in circulation, based on the last time of transaction.
By comparing them on a daily basis, you get a sense of whether the current price is over or undervalued.
The MVRV ratio tells us if the current price of Bitcoin is trading below or above “fair value”. When the MVRV ratio = 1, it is said to be fairly priced. However, like growth companies whose P/S are never at 1, Bitcoin’s MVRV ratio is usually above 1.
How to use the MVRV ratio?
The lower the MVRV ratio, the better.
Hence, the MVRV ratio is best used against the Bitcoin price chart, to give you a better idea. Woobull.com gives us such a comparison:

- Pros
MVRV has been fairly accurate over the past few years of Bitcoin’s growth, highlighting areas of over and undervalued periods historically. It is fairly easy to read and interpret the ratio.
- Cons
As volatility drops, on-chain analysts have warned about a downward drift. This could affect the accuracy of MVRV over time and possibly render the MVRV inaccurate in the future. Be sure to compare it against other metrics before using it!
You can read more about MVRV and how it works here.
2) RHODL Ratio
Realised HODL Ratio = Realised HODL (1 week) / Realised HODL (1year) * total market age
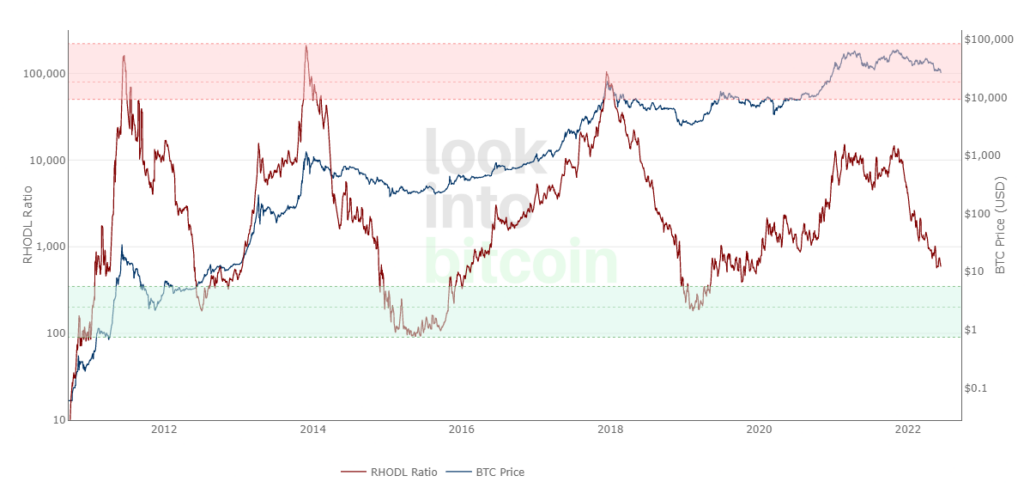
HODL = Hold On for Dear Life.
Realised HODL volume ironically tells us how many HODL-ers are selling. The RHODL ratio compares the short term (1 week) realised HODL volume vs the long term (1-2years) realised HODL volume.
So far, the RHODL ratio has been accurate in identifying the highs and lows of Bitcoin’s cycle. This was apparent during April 2013 where the RHODL didn’t reach the red zone when Bitcoin first reached an All-Time-High (ATH). Instead, the RHODL ratio held on till the actual high in early 2014.
How to use the RHODL Ratio?
RHODL ratio goes up when people start buying more, indicating increasing market interest.
Use the red zone (RHODL highs) and green (RHODL lows) zones in the live chart as another data point for clarity. When RHODL is in the green zone, its usually a good (but scary) time to accumulate.
- Pros
The RHODL ratio has been accurate since the early days of Bitcoin and has held true for multiple cycles. It is also fairly easy to interpret.
The potential Lindy Effect has been calibrated into the ratio by including the market age into the calculation, this could help to future proof this metric.
- Cons
Future investor habits and changes in volatility may skew the RHODL ratio, for example, if investors start HODL-ing for longer periods as Bitcoin matures.
Also, it tells you what’s happening now and cannot forecast the future. Actually, none of the metrics on this list is capable of forecasting future movements.
You can read more about the RHODL ratio here and here.
3) Relative Strength Index
Relative Strength Index (RSI) is used to determine when a stock is oversold or overbought. Bryan explained how the RSI works in this article.
This is the only non-Bitcoin specific metric on this list and you can generate it for free on tradingview. For more, read my article on the best technical analysis indicators for crypto trading.
That said, as Bitcoin is relatively young, there are no strong RSI windows for us to refer to, unlike in stocks.
How to use the RSI with Bitcoin prices?
Cryptocurrency analysts have adapted the RSI to the BTC price chart directly, using a range of 30 (bottoms) and 70 (tops). That said, according to multiple sources, Bitcoin’s all-time highs tend to correspond to an RSI of above 93.
This means that if the RSI is above 93, Bitcoin is definitely overbought. Don’t buy!
How to use RSI to determine if Bitcoin is oversold or overbought?
- Go to tradingview.com
- Select the ‘BTCUSD’ chart
- Click on Indicators, search and select Relative Strength Index:

- Using the default 2 weeks RSI indicator within the 30 to 70 range, this is how Bitcoin looks like at the point of update:
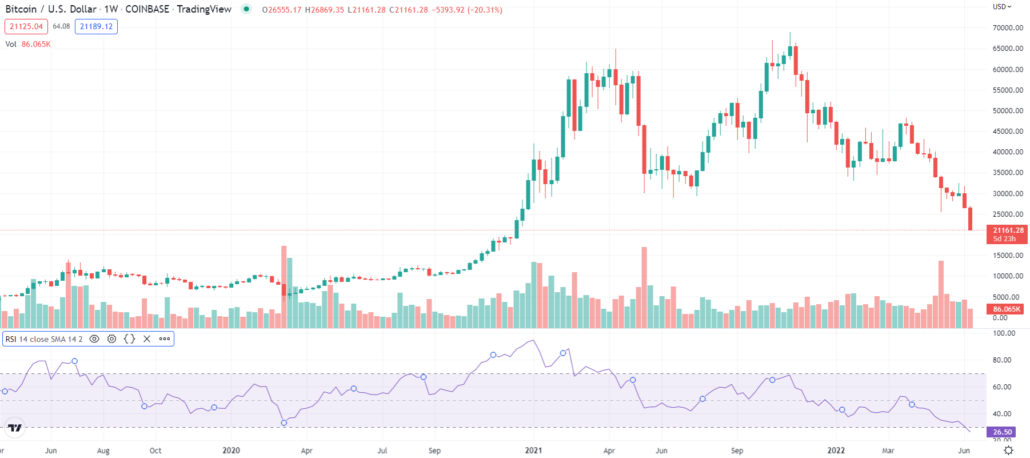
The RSI is currently very low as the market is experiencing a selldown and Bitcoin has a strong downward momentum currently.
To give you a point of reference, these were the RSI levels at previous Bitcoin ‘crashes’:

Lowest RSI recorded at:
- 2014 – 2015 ‘crash’: 27.8
- 2018 – 2018 ‘crash’: 28.6
- Mar 2020: 33.8
At the point of update on 14 Jun 2022, the RSI for Bitcoin is currently at 26.5.
And these were the RSI levels at previous Bitcoin highs:
RSI was at 90.5 during Bitcoin’s 2018 run:

And RSI was at 95 during Bitcoin’s march 2021 bull run:

Based on the historical performance, it would seem that Bitcoin lows correspond to an RSI of less than 50. You may want to queue for opportunities when RSI is at the level.
- Pros
Humans approach Bitcoin like most other investments and tend to buy and sell based on similar emotions, hence the RSI can be used as a strong indicator of market sentiment.
Plus, we can easily get the RSI from many charting software or platforms.
- Cons
The correlation of Bitcoin to RSI may not be exactly the same as that of stocks, do not use it blindly.
How to buy the f**ing dip?!
The resources above are some simple on-chain metrics and indicators that give you an idea of the current Bitcoin market sentiments and hopefully an idea of how ‘high’ Bitcoin is priced at the present moment.
That said, don’t use any of them alone. Instead, you should compare several before deciding if it’s a good time to enter.
But remember (disclaimer!), these metrics are derived from historical transactions and historical movement does not guarantee or predict future moves. Do your own due diligence, and do check the latest commentary on the related metrics to determine if they are still accurate when you are using them.
Also, beware of the blind spot!
As we have learnt from the UST-LUNA crash, there are many folks with leveraged positions in Bitcoin and Ethereum. And as prices continue to fall, there is a chance that these positions would get liquidated. When that happens, it could lead to a downward cascade, bringing prices even lower. So, beware!
If you wish to learn more about Bitcoin and the potential pitfalls to avoid in crypto, join AK at his live webinar for the latest. Or, read our Bitcoin Investing Guide here.