This was originally shared by a graduate from Dr Wealth’s Early Retirement Masterclass. For privacy reasons, the author has requested for his identity to be kept private.
Last week I attended the Early Retirement Masterclass by Christopher Ng. I was impressed with the course as it was based on sound academic research and equipped us with the skills necessary to adopt a data driven approach to investing.
I will use one of Chris’s strategies to pick blue chip stocks as an example in this article. Primarily, Chris advocates the smart beta approach to fish out stocks based on certain factors such as price to earnings ratio, free cash flow yield, net profit margin and momentum.
Stocks with low price to earnings ratios were chosen because they are cheap relative to their earnings. These stocks are undervalued relative to other stocks due to the market’s overreaction to bad news. This gives value investors the opportunity to take advantage of the low prices to make huge profits when the prices revert back to their fair value.
Stocks with high free cash flow yield were chosen because these stocks have the ability to generate cash flow relative to their price after accounting for cash outflows to maintain their capital assets. These stocks tend to have a strong ability to repay creditors and pay dividends to investors.
Stocks with high net profit margins have high net income relative to their revenue. These companies usually have good financial health, good management and strong growth potential.
Stocks with high price momentum tend to do well because trends persist. Stocks that have gone up over the past 6 to 12 months are more likely to go up further. There are also behavioural reasons such as herding that explain why momentum works because individual decisions are influenced by group behaviour.
Why I believe in backtesting an investing strategy
I ran a backtest to simulate how Christopher’s strategy would have performed since 2008 (we used a backtesting tool at PyInvesting.com). This backtest is important to me because it validates (or invalidates) the strategy over the past decade. I would prefer to run a simulation than to risk my hard earned money to find out if a strategy works. Moreover, a successful set of backtest results would give me the confidence to stay invested as the market goes through periods of volatility.
The backtest also allows me to see how the strategy has performed during stock market crashes, such as the 2008 global financial crisis and the current Covid-19 public health crisis. I would be able to know my portfolio’s losses during these events and honestly ask myself if I can accept the drawdown magnitudes before pursuing the strategy with my money.
How to backtest an investing strategy
Start here to run a backtest. Click on the “Select your stocks” button. A new window would open up and you should select stocks for your backtest. Under “template portfolios”, click on “Straits Times Index” to select stocks from the index.

Next, scroll down to the benchmark section and remove the default S&P 500 benchmark by clicking on the cross and add the STI ETF as a benchmark.

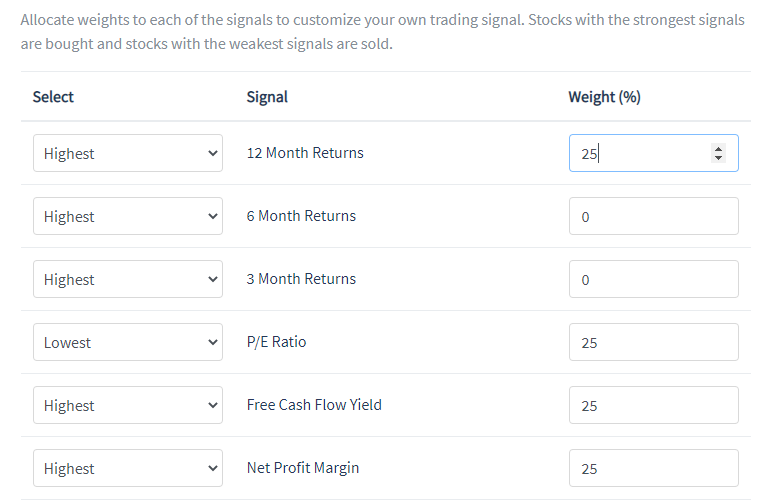
In the next section, select the factors that your strategy uses to rank your stocks by assigning weights to each factor. I assigned an equal weight of 25% to the lowest PE ratio, highest 12 month returns (momentum factor), highest free cash flow yield, and highest net profit margin. These factors are combined using the z-scoring methodology described in the Early Retirement Masterclass to form the overall signal.

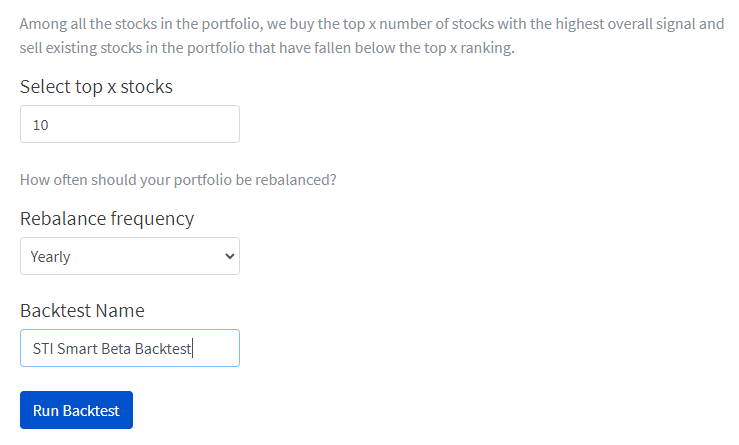
I selected the top 10 stocks with the strongest overall signal to include in the portfolio during each rebalancing period. The rebalancing frequency was set to a yearly frequency and the backtest was named as the “STI Smart Beta Backtest”.

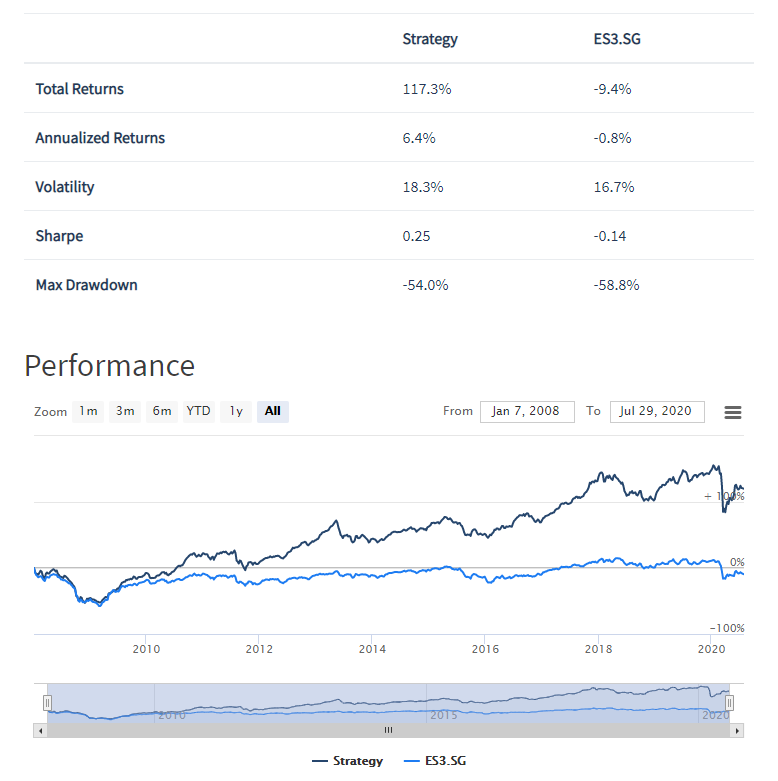
The results showed that the smart beta strategy significantly outperformed the STI benchmark with an annualized return of 6.4% vs -0.8% since 2008. The strategy also has a higher Sharpe Ratio of 0.25 vs the STI which had a Sharpe Ratio of -0.14, implying that the strategy has higher risk adjusted returns.

Singapore stocks are not dead, depends on what you have picked
One of the common perceptions that people have is that the Singapore market is “dead” because the Straits Times Index has an annualized return of -0.8% since 2008. After all, which investor would want to invest in an instrument that loses 0.8% every year on average? However investors should also note that the Straits Times Index is a market cap weighted index where the largest 5 companies (3 of which are local banks, DBS, OCBC, UOB) in the index make up around 50% of the index. Hence poor performance from these few companies could drag the index results and cast a bad light on the Singapore stock market. Our backtest results have shown that the Singapore market was far from “dead” because there were other stocks that have strong exposure to smart beta factors have been profitable for investors.
This backtest also proved that Chris’s smart beta strategy works. We just need to select stocks with the lowest PE ratio, highest 12 month returns, highest free cash flow yield, and highest net profit margin and we can expect to outperform the Straits Times Index by 7.2% per year (not every year, but on an average).
I’ve started using some of these smart beta factors in my own personal investment strategy after attending Chris’s Early Retirement Masterclass. In fact, I have programmed the strategy on PyInvesting and now runs automatically for me – each day, the data will be updated at PyInvesting and I would receive an email to inform me of my current positions and the orders I need to place to rebalance my portfolio.

