REITs had a terrible week.
The sell-off started from 11 Mar 2020 and there was no end in sight even on 19 Mar 2020.
Here’s the quick battle damage assessment. I’m not doing this to ridicule those who have invested in REITs but to do a stock take of the markets because everything happened so fast and in such a huge degree.
S$37 billion were wiped out from REITs market capitalisation in 7 trading days.
2 REITs, Dasin Retail Trust and Frasers L&I Trust (AUD), declined 1.87% and 2.26% respectively but that was due to low liquidity and little trading of the units. Hence I suspect that’s not the true reflection of the investors’ sentiments. They may just gap down when future trades are done.
All the other REITs have lost at least 25% in the last 7 trading sessions.
25 REITs lost more than 10% on 19 Mar 2020 alone.
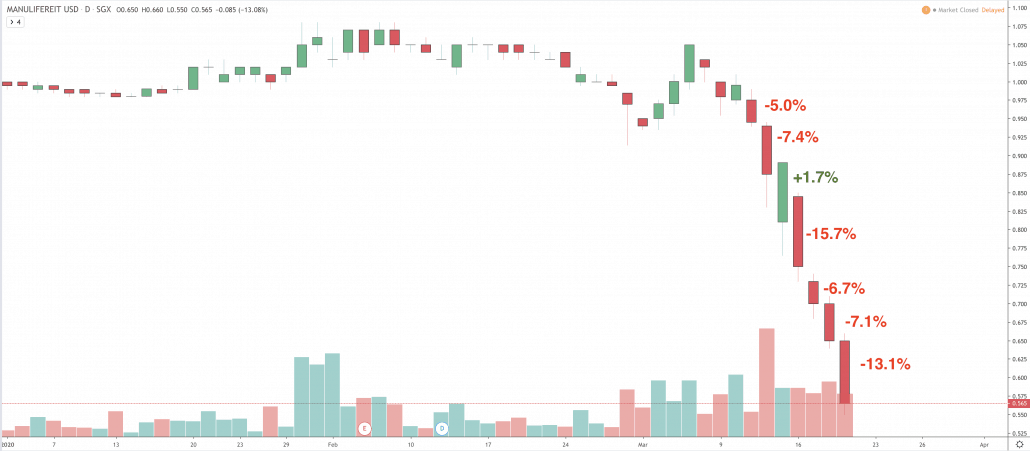
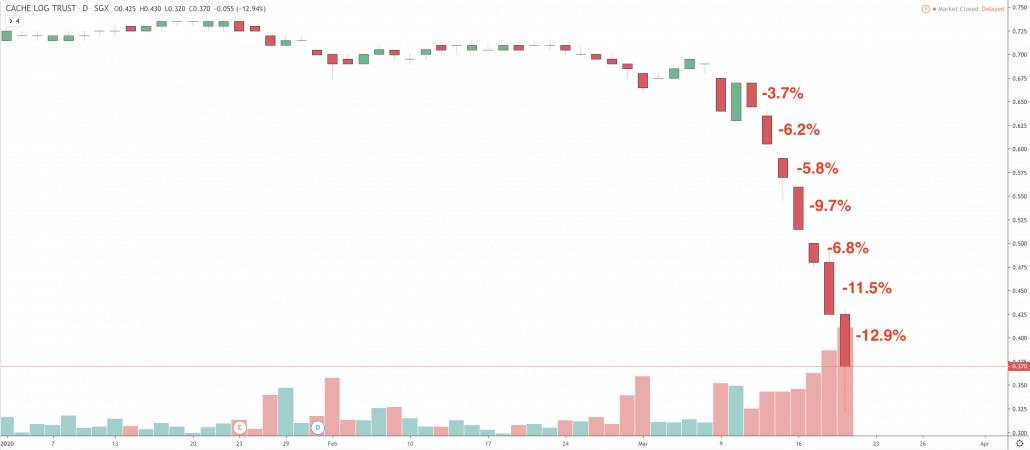
There were 18 REITs that lost more than 50% in 7 trading days. Here’s a quick rundown on the consecutive days of selldown visually.
#18 – Frasers H Trust (SGX:ACV) -50%

#17 – Frasers Comm Trust (SGX:ND8U) -51%

#16 – Sabana REIT (SGX:M1GU) -52%

#15 – Cromwell REIT SGD (SGX:CSFU) -53%

#14 – Cromwell REIT EUR (SGX:CNNU) -53%

#13 – Manulife REIT (SGX:BTOU) -53%
#12 – Lippo Mall Trust (SGX:D5IU) -55%

#11 – Prime US REIT (SGX:OXMU) -56%

#10 – Frasers L&I Trust (SGX:BUOU) -56%

#9 – Cache Log Trust (SGX:K2LU) -57%
#8 – Keppel Pacific Oak REIT (SGX:CMOU) -57%

#7 – First REIT (SGX:AW9U) -58%

#6 – IREIT (SGX:UD1U) -58%

#5 – ARA HTrust (SGX:XZL) -58%

#4 – CDL HTrust (SGX:J85) -59%

#3 – SoilbuildBiz REIT (SGX:SV3U) -68%

#2 – ESR REIT (SGX:J91U) -69%

#1 – Eagle Hospitality Trust (SGX:LIW) -77%

What’s worse is that Eagle HTrust has called for a trading halt at the time of writing and we are not sure what is going to happen next.
I have also tabulated the performances of the REITs below. It seems like the REITs are selling at very attractive prices.
| Name | Code | 11-Mar-20 | 12-Mar-20 | 13-Mar-20 | 16-Mar-20 | 17-Mar-20 | 18-Mar-20 | 19-Mar-20 | Total Drop |
|---|---|---|---|---|---|---|---|---|---|
| Eagle H Trust USD | LIW | -3.0% | -10.9% | -5.3% | -13.0% | 2.1% | -10.4% | -36.3% | -76.8% |
| ESR REIT | J91U | -2.0% | -8.0% | -9.8% | -13.3% | -6.9% | -9.0% | -19.7% | -68.6% |
| SoilbuildBiz REIT | SV3U | -2.2% | -6.6% | -7.1% | -11.4% | -8.6% | -17.2% | -15.1% | -68.0% |
| CDL H Trust | J85 | -1.5% | -9.4% | -3.5% | -10.7% | -8.5% | -6.6% | -18.7% | -58.9% |
| ARA H Trust USD | XZL | -1.7% | -10.4% | -6.8% | -10.4% | -5.8% | -3.7% | -19.2% | -58.1% |
| IREIT Global | UD1U | -0.7% | -6.6% | -6.3% | -14.3% | -7.0% | -13.2% | -9.8% | -57.9% |
| First REIT | AW9U | -0.5% | -6.0% | -10.3% | -9.0% | -5.6% | -10.5% | -15.8% | -57.7% |
| KepPacOak REIT USD | CMOU | -2.8% | -10.0% | -5.6% | -8.4% | -4.6% | -14.4% | -11.2% | -57.0% |
| Cache Log Trust | K2LU | -3.7% | -6.2% | -5.8% | -9.7% | -6.8% | -11.5% | -12.9% | -56.6% |
| Frasers L&I Trust | BUOU | - | -8.1% | -7.1% | -11.9% | -6.0% | -5.2% | -17.6% | -55.8% |
| Prime US REIT | OXMU | -2.6% | -8.1% | -3.5% | -8.5% | -6.0% | -10.6% | -16.5% | -55.7% |
| Lippo Malls Trust | D5IU | -0.5% | -5.3% | -8.9% | -8.5% | -10.0% | -5.2% | -16.4% | -54.8% |
| Manulife REIT | BTOU | -5.0% | -7.4% | 1.7% | -15.7% | -6.7% | -7.1% | -13.1% | -53.4% |
| Cromwell REIT EUR | CNNU | -3.0% | -7.2% | -3.3% | -13.8% | 6.7% | -16.3% | -16.4% | -53.3% |
| Cromwell REIT SGD | CSFU | -2.5% | -7.8% | -7.0% | -7.6% | - | -12.3% | -15.9% | -53.1% |
| Sabana REIT | M1GU | -1.2% | -7.3% | -6.6% | -7.0% | -4.6% | -6.4% | -18.6% | -51.7% |
| Frasers Com Trust | ND8U | - | -8.0% | -5.4% | -10.6% | -8.7% | -2.6% | -16.1% | -51.4% |
| Frasers H Trust | ACV | -2.5% | -4.3% | -8.9% | -7.8% | -11.7% | -2.4% | -12.4% | -50.0% |
| EC World REIT | BWCU | -2.1% | -2.9% | -9.8% | -5.8% | -2.7% | -8.2% | -15.8% | -47.3% |
| Utd Hampshire REIT USD | ODBU | - | -20.0% | -3.1% | -3.2% | -1.7% | -7.6% | -9.2% | -44.8% |
| Starhill Global REIT | P40U | -0.8% | -7.1% | -1.7% | -9.6% | -5.8% | -10.2% | -9.1% | -44.3% |
| Far East H Trust | Q5T | -1.7% | -6.0% | -2.8% | -10.4% | -4.2% | -5.5% | -12.8% | -43.3% |
| Ascott REIT | HMN | -2.7% | -8.3% | -5.0% | -8.4% | -6.3% | 0.6% | -12.2% | -42.3% |
| OUE Com REIT | TS0U | -1.1% | -8.0% | -3.7% | -9.0% | -5.6% | -6.0% | -7.9% | -41.3% |
| Suntec REIT | T82U | -1.8% | -4.8% | -5.0% | -9.2% | -5.1% | -3.8% | -10.3% | -39.9% |
| Mapletree NAC Trust | RW0U | - | -6.3% | -5.7% | -9.1% | -6.1% | -3.6% | -8.6% | -39.3% |
| Mapletree Ind Trust | ME8U | -2.0% | -5.1% | -2.9% | -11.2% | -10.5% | -0.5% | -7.0% | -39.2% |
| Ascendas iTrust | CY6U | -0.7% | -9.8% | -11.6% | -9.0% | 4.5% | -3.5% | -8.0% | -38.1% |
| Mapletree Log Trust | M44U | - | -6.9% | -1.1% | -16.2% | -5.5% | -1.5% | -6.7% | -37.9% |
| BHG Retail REIT | BMGU | -0.9% | -3.5% | -7.1% | -4.8% | - | -1.0% | -20.4% | -37.7% |
| AIMS APAC REIT | O5RU | - | -4.4% | -6.1% | -7.3% | -10.4% | 1.9% | -11.4% | -37.6% |
| SPH REIT | SK6U | -1.5% | -4.5% | -3.7% | -4.9% | -8.1% | -7.5% | -6.8% | -36.9% |
| Frasers Centrepoint Trust | J69U | -1.7% | -4.2% | -6.2% | -9.8% | -5.6% | -4.1% | -4.3% | -36.0% |
| CapitaR China Trust | AU8U | -1.4% | -5.8% | -7.7% | -7.5% | -4.5% | - | -8.5% | -35.4% |
| Keppel REIT | K71U | 0.8% | -4.1% | -6.8% | -8.2% | -5.0% | -2.1% | -9.6% | -34.8% |
| Elite Com REIT GBP | MXNU | -0.7% | -8.0% | 4.8% | -8.3% | -2.5% | 1.7% | -19.2% | -32.3% |
| Lendlease REIT | JYEU | -3.1% | -9.7% | -11.4% | -19.4% | -4.0% | 11.5% | 5.6% | -30.5% |
| Sasseur REIT | CRPU | -1.4% | -5.6% | -1.5% | -8.3% | -1.6% | -1.7% | -10.2% | -30.2% |
| Keppel DC REIT | AJBU | -1.7% | -8.6% | -0.5% | -11.3% | -3.2% | 1.6% | -5.4% | -28.9% |
| ParkwayLife REIT | C2PU | -0.3% | -3.1% | -5.6% | -6.9% | -4.4% | -1.4% | -7.1% | -28.8% |
| CapitaMall Trust | C38U | -2.1% | -3.0% | -3.1% | -8.3% | -5.0% | -3.7% | -1.6% | -26.8% |
| CapitaCom Trust | C61U | -2.0% | -5.2% | -2.7% | -8.4% | -4.9% | -1.3% | -3.3% | -25.8% |
| Mapletree Com Trust | N2IU | - | -4.9% | -3.7% | -12.1% | -2.8% | - | -2.3% | -25.7% |
| Ascendas REIT | A17U | -0.6% | -5.1% | -4.4% | -8.3% | -5.8% | 0.8% | -1.9% | -25.4% |
| Frasers L&I Trust AUD | BWQU | - | - | - | - | - | - | -2.3% | -2.3% |
| Dasin Retail Trust | CEDU | - | -0.6% | - | -0.6% | - | - | -0.6% | -1.9% |
Why REITs get sold down? Why now and not earlier?
These are the questions I had but found no answers. I dug the insider trades and found no big players dumping the stocks. It could be the retail players dumping REITs but it is hard to accept retail can move prices so much and the trading volume was higher than normal.
Equally surprising was that there was almost no safe haven assets during this time. Bonds, gold and bitcoin got sold down too. I noticed that USD and JPY had strengthened.
It seems like people are clamouring for cash. Probably because this is not a financial crisis but a survival threat should the virus be spread to every single human being. You can’t buy instant noodles and toilet paper with stocks, REITs, bonds, or bitcoin (not yet). Even gold would face difficulty. That’s my speculation of the fear displayed in the financial markets.
I’m not sure what’s the true cause. What do you think?
Margin call from Investors looking for yield.
Why bother for a reason? Looks cheap now!!!
Yes, its investors hoarding cash. Retail investors preparing cash for daily needs and institutional investors preparing cash for drawdowns. Assets from all classes are falling and, as you said, no safe havens. Cash is really king now.
Hi Alvin,
I referred to the Document : ‘Highlights of the Week’ published by The SGX for the following period and I found the following events pertaining to some REITs.
For Week of 9 – 13 March 2020 :-
Institutions were Net Buyers of MCT and Ascendas REIT with total values of $55mils, and Retail Investors were Net Seller with total values of $16mils.
So,… looks like Retailers were truly Net Sellers with quite big transaction values.
Thanks for this great effort in making this…