Ask any investors whether Singapore bank stocks are good investment and cChances are many will say yes. They will praise about their infallible market position and powerful balance sheet.
But the truth is, banks are naturally leveraged companies and their Debt-to-Equity Ratios can be at least 500%!
That means should a bank run occurs they won’t be able to meet all immediate depositor’s demand. They can still bankrupt. Your investment value can still fall to ZERO!
Since banks’ financial statements are totally different than your run-of-the-mill stocks I will NOT be using factor-based investing strategies.
Instead, I’ll be evaluating their cheapness & potential based on the 5 factors below.
#1. Price-to-Book Ratio
One of my favourite ways of investing is to buy assets (net of liabilities) below their value. And supporters of Dr Wealth will know that we use a strategy known as the Conservative Net Asset Value (CNAV). But CNAV would be too stringent for banks since their business model is to take in depositors money and then lend them out for higher interests. This means the depositors money can be an asset and a liability at the same time, leaving little room for the bank’s net asset value (NAV). Hence, discounting the assets further will almost erode the entire NAV.
That said, we can still use the asset method to evaluate the bank stocks. We just use the good ol’ price-to-book ratio (PB Ratio).
You would notice that analysts like to plot the historical PB Ratio of the bank stocks to determine the average PB that they are trading at. I find this useful as investors would notice it is pretty rare to find a Singapore bank trade below PB ratio of 1.
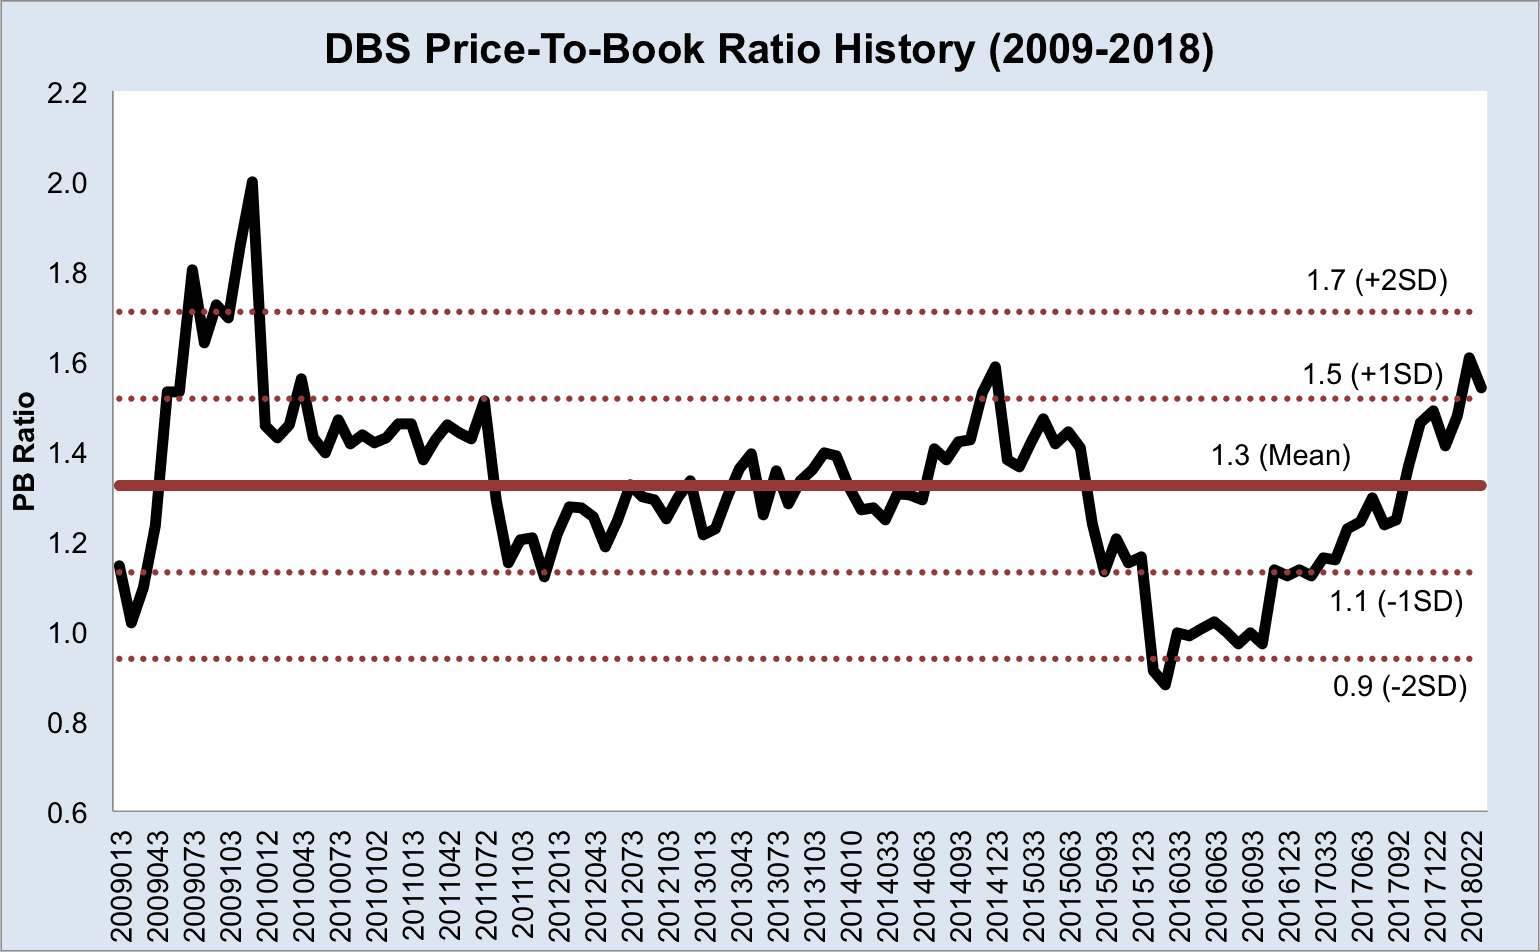
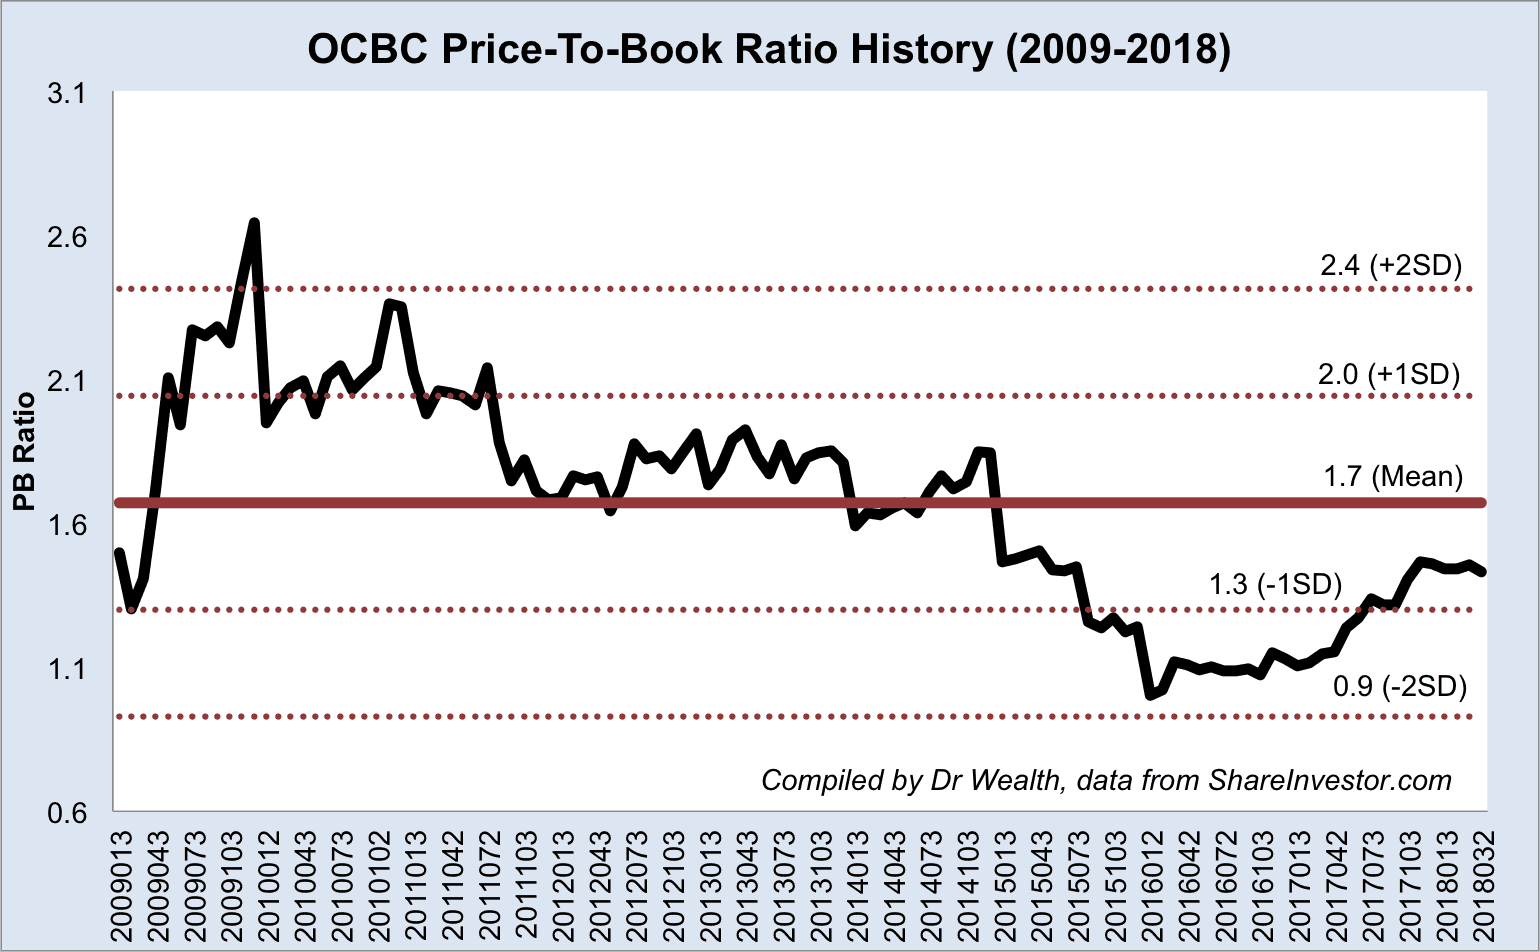
I have used data from Shareinvestor.com to plot the PB Ratio history of DBS, OCBC and UOB in charts. I have used the previous year’s Book Value for subsequent year’s share price to determine the PB Ratio. In other words, 2017 stock prices is divided by 2016’s Book Value. This makes sense to me because we always invest based on historical data, else there would be look-forward bias in our reconstruction of the past.
The mean PB Ratio for DBS was 1.3 for the past 10 years. The current PB Ratio of 1.5 is 1 standard deviation above the mean. This means that the share price isn’t cheap anymore.

The mean PB Ratio for OCBC was 1.7 in the past 10 years, which was higher than that of DBS. However, OCBC is relatively cheaper with its PB Ratio at around 1.4, which is below the mean of 1.7.

Last but not least, the mean PB Ratio for UOB was 1.5 in the past 10 years. The current PB Ratio of 1.3 is just below the mean.

Relatively, OCBC and UOB seemed cheaper than DBS and would be better choices at the moment if you are into bank stocks.
That said, I realised my results differ from that of the analyst from Maybank Kim Eng. Ng Li Hiang covered the three local banks and published the report on 20 Mar 2018. Ng’s mean PB Ratio for DBS, OCBC and UOB were 1.2, 1.3 and 1.3 respectively. First, Ng used a period that was longer, from 2005 to 2018. Second, Ng used 12-month forward rolling PB Ratios while I used historical values.
But the conclusion Ng and I arrived at were the same – OCBC and UOB are cheaper stocks than DBS.
#2. Non-Performing Loans (NPL) Ratio
One of the major concerns for banks is the loans at risk of not being repaid. This could result in writing off the bad loans and would lower the assets of the banks. In turn the book value could be eroded and the historical PB Ratio may not be a reliable indicator as a result.
Hence, it pays to watch the Non-Performing Loans (NPL) Ratios of the banks. In recent years, the concern was the banks’ exposure to the oil and gas industry. In the future it might be another sector and banks should diversify as much as possible to reduce concentration risk.
| Banks | NPL Ratio (2017) |
| DBS | 1.7% |
| OCBC | 1.5% |
| UOB | 1.8% |
As we can see, the three banks’ NPL Ratios are similar with UOB being the highest. But seriously, there’s not much difference.
In terms of credit concentration by industry, the top three exposures for DBS are Housing Loans (22%), Building and construction (20%) and General commerce (16%)

The top three industry exposures for OCBC are Housing loans (27%), Financial institutions (16%) and Building and construction (15%).

The top three industry exposures for UOB are Housing loans (28%), Building and construction (23%) and General commerce (13%).

We can see that their loan profile in terms of industry are similar. Only OCBC has a greater exposure to financial institutions. But in general each bank is quite diversified by industries.
I would be less concerned with the housing loans as they are collaterised – the underlying assets could be seized and sold by the banks to recover the loans.
#3. Return on Equity (ROE) and Return on Assets (ROA)
Being highly geared companies, banks usually have high ROE but low ROA. I will compare the banks with these two metrics to have a sense who made the assets work harder.
| Bank | ROE | ROA |
| DBS | 9.7% | 0.89% |
| OCBC | 11.2% | 1.14% |
| UOB | 10.2% | 0.98% |
Among the three banks, OCBC has the highest ROE and ROA but the difference is minimal. I would say they are comparable. Too much of something good is also dangerous. Very high ROE may also mean aggressive lending and leverage on the capital they have.
#4. Dividend Yield and Payout Ratio
Next we can consider how much dividends each bank paid out, and if they have any dividend policies for their shareholders.
The three local banks do not set a fixed rate of dividend payments but have been consistently distributing half-yearly dividends.
For FY17, the dividend per share and dividend yield for each bank were:
| Bank | Dividend per share | Dividend Yield | Share price | Payout Ratio |
| DBS | $0.93 (excluding special dividend of $0.50) | 3.3% | $27.94 | 0.6 |
| OCBC | $0.37 | 2.9% | $12.81 | 0.4 |
| UOB | $0.80 (excluding special dividend of $0.20) | 2.9% | $27.78 | 0.4 |
DBS offered the highest dividend yield but with a higher payout ratio of 0.6. This means that DBS retained less earnings (in percentage terms) as compared to OCBC and UOB. DBS management must have believed that the capital was sufficient to fund future growth and could afford to reward more dividends to shareholders.
As an industry, I can see their dividend policies are similar – pay out about half of the earnings and yielding around 3%.
#5. Growth Potential
Let’s look at their historical growth first. All three banks have exhibit total income growth in the past 5 years.

But it is difficult to ascertain which bank has grown the fastest over the five years just by looking at the chart.
We can calculate the compounded growth rate to make the comparison easier.
OCBC has the highest compounded growth rate of 10%, DBS with 8% and lastly UOB with 7% in the past 5 years.
How are the banks going to continue to grow their total income?
(1) Geographical expansion
The banks derive almost half of their income from Singapore (see charts below). This either means there are a lot of opportunities to grow beyond Singapore shores or geographical expansion is difficult because of entrenched competitors in foreign countries. One way to grow is through merger and acquisition of banks in the region. For example, OCBC acquired Wing Hang bank in Hong Kong as a way to expand their geographical reach. This is usually an expensive way to grow and could only be done when opportunity arises.


(2) Ride on Singapore’s economic growth
Another avenue of growth is to continue the focus on capturing market share in Singapore. Our economy is still growing which would translate to more loans required by businesses and individuals. Since the local three banks derive most of their income in Singapore, it would make sense for them to focus on protecting their pie here against foreign banks.
(3) Grow specific business segments
Banks have many business segments. One promising segment was wealth management for high net worth individuals. With ever rising numbers of rich individuals in Singapore, it is not surprising that this is a growing businesses for the banks. Traditionally UBS and Credit Suisse are the go-to private banks for wealth management. The local three banks have done well in the past years to grow their wealth management business.
In 2017, the growth of wealth management income of DBS, OCBC and UOB from a year ago were 25%, 43% and 36% respectively!
This business segment may continue to be a driver for the three local banks’ income in many years to come.
Quick Conclusion
The three local banks are similar in many ways. They yielded similar ROE and ROA. They pay more or less the same amount of dividends in proportion to their earnings and their yield is around 3%. Their Non-Performing Loan Ratios were close, ranging tightly from 1.5% to 1.7%. The credit risk is well diversified among the various industries. They derived most of their income from Singapore. Their wealth management businesses are growing fast. This made it hard for an investor to pick one among the three.
Since the quality of the banks are not discernible, it boils down to price and valuation.
I have shown that the key metric would be the PB Ratio. And historically each bank trade at a different PB Ratio band, and it makes sense to consider buying when the current PB Ratio is below the historical mean, or even closer to 1 standard deviation lower. In this respect, OCBC and UOB are relatively cheaper to buy than DBS.


Well researched & written
Hi, OCBC might pay higher dividend immediately after divest GE but how d divestment affect it’s return in later yrs since GE contribute significant portion of income? I think this can’t b underestimated. How big the portion of GE is to be “sold”? Tks.