Editor’s Notes
The fall out from unforeseen financial market crashes is real – even if it may not affect you personally.
I watched rich relatives mysteriously disappear from family gatherings while others downgraded from a 4 story Bungalow that made my legs ache climbing to a HDB flat that looked positively squalid in comparison.
I watched some arbitrage living expenses by spending half the year in Thailand/Malaysia/Vietnam. It all seems fun and games until you realise they do it because they can’t have the same standards of living in Singapore.
Few people – if any – try to understand and contain the risks to their investments in the stock market, and yet it is crucial that we maintain and search for a robust framework that can contain the risks to our invested monies.
We cannot afford to slack in this regard.
Eng Guan and Patrick are professionals whose job is to manage such risk while generating safe, respectable returns over time.
And they are the professionals that we (Dr Wealth) have aligned with in order to provide a means to the retail investor on the street to generate consistent returns while being guarded against Black Swan events. This is their backtested portfolio performance.

Notice that the portfolio would have lost just 5% in 2008 during the worst of the global financial crisis and that overall, the portfolio generated 14% a year while allowing all of us to sleep easier at night.
- 2015 Swiss National Bank scrapped Franc’s peg to Euro
- 2016 Brexit
- 2018 Vol-armageddon
None of the above events affected model performance – even with multiple black swans.
To put that into perspective, starting with $30,000 capital and injecting $12,000 of savings ($1k per month) every year would have you sitting on a portfolio worth over half a million, at $638,813.25.
- Article starts here –
The markets are fraught with perils. All investments entail a real risk of loss in return for the potential upside.
But what exactly are those risks?
For that, you can refer to a fund prospectus. It actually gives you a good breakdown of the types of risks involved.
Just to name a few:
- market risk
- liquidity risk
- operational risk
- FX risk
- valuation risk.
What perhaps is not that explicit is the possibility of extreme loss as a result of extraordinary market events.
Nassim Nicholas Taleb characterized these as Black Swan events. In this post, we will look at these events and how they can impact us (our investments).
What are Black Swan Events?
/2008-financial-crisis-3305679-final-JS-03a006d464d7465aaf331145a1252beb.png)
The term “Black Swan” originates from the (Western) belief that all swans were white because these were the only ones accounted for. However, in 1697 the Dutch explorer Willem de Vlamingh discovered black swans in Australia.
It was an unpredictable and shocking event, whose name has now come to be synonymous with unpredictable market crashes that can wipe off trillions of dollars from the markets.
These are events that can wipe out entire accounts and send people into a state of utter despair. They happen often without warning and are capable of inflicting terrible damage in a very short span of time.
But, despite the magnitude of their impacts, it is often overlooked due to 2 reasons.
- Firstly, people think the chance of such events happening is exceedingly low.
- Secondly, there is no way one can foresee when it is coming. So why bother wasting time and resource on it?
Such under emphasis is dangerous. This leads to situations where we underestimate the severity of the loss that can occur.
If you are in the market long enough, you will know that the probability of encountering such events are far from remote.
In spite of that, most people force-fit real-world occurrences onto your typical bell curve or normal distribution.
For example, our most widely used risk measure in the industry, volatility, assumes compounding stock returns (log returns) follow a normal distribution.
There is actually nothing wrong in making model assumptions. As a systematic investor, I use such assumptions all the time.
The problem comes when we rely on these numbers like the gospel truth. Because it gravely understates the probability of a catastrophic event. Real-world distributions have fatter tails than what a normal distribution implies – in other words, your chances of having an abnormal loss is heavier than you think, believe, and understand in all of its nuances.
What are Fat Tails?
*Warning, maths ahead*
To understand, take a look at the diagrams below.

This is just to accentuate the concept of fat tails.
For simplicity, I am actually still using a normal distribution here. But I have increased the standard deviation of the distribution denoted by the orange line. This is not exactly a correct representation, but I just want to highlight the fat tails.
Actual distributions will not look like this.
Let us use the S&P 500 daily log returns as an example. If you plot the actual distribution and compare it against what normal distribution suggests, you will notice that actual returns are more concentrated around the mean. But it also comes with visibly higher tail occurrences in excess of 3 standard deviations or more.


These fat tails explain why extreme profits or losses occur a lot more frequently than expected.
In fact, many such spectacular events happen in the course of history. And after they strike, news about professional funds biting the dust will almost always follow.
Let’s see a real event.
Black Monday 19 October 1987

What happened?
When it comes to Black Swan, there are hardly any rivals against Black Monday in terms of reputation. Global markets, which were already in the midst of a pullback, crashed violently on and after 19 October 1987. US S&P 500 plummeted 20.5% on that single day, triggering a deep rout across Asia and Europe.
At the end of the month, worldwide stock markets were swimming in a sea of blood. To give a sense of the damage, in just a month, the US and Germany were down more than 20% while Hong Kong and Australia plunged over 40%. Markets spent the next few years nursing its wounds, and some did not emerge from its losses until the 90s.
What caused the crash?
Many theories abound regarding what triggers the plunge. Program trading bore the brunt of the blame.
Others claim its high stock valuations, and some point their fingers on innovations such as portfolio insurance for aggravating the sell-offs.
All have probably contributed to that fateful day. But no one knows for sure what really sets off the “bomb”.
It is always easy to look back and rationalize what happened.
There is no lack of people who will rush to comment on the events after it has taken place. You will hear many things along the lines like “The warning signs are all there. It is basically screaming at us. It is so clear that the market is going to crash big time.”
All these post-event analyses may look sound on the surface, but it will do little to help anyone in forecasting the next black swan event.
What are the odds of such an event happening based on our conventional normal distribution?

Let’s use S&P 500 as an example.
Prior to the event, the historical average daily log return since 1950 hovers around 0.03%.
And the corresponding standard deviation(SD) is 0.79%.
Mathematically, this means 68% of all possible returns fall within -0.76% (0.03%-0.79%) and 0.82% (0.03%+0.79%), or one standard deviation (1 SD) of the average.
If we expand this range to 2 SD, -1.54% to 1.60%, we expect to capture 98% of the variability of the returns. And if we go even higher to 3 SD, -2.33% to 2.39%, then we cover 99.7% of the daily returns. By now, you should get the gist of it.
So, what does a -20.5% (translates to a log return of – 22.9%) move on 19 October 1987 represents?
This is an event outside of 29 SD.
Way off the charts by any counts.
And if we go by a normal distribution, the probability of it occurring is an infinitesimally small number 3.29 E-185.
Or put it in another perspective, we expect such events to occur once every 1.21E+182 years. This is enough time to go way back even before our universe is born. Well, you might actually have better luck finding extraterrestrial life.
But we know that such events, while rare, definitely occur a lot more frequently than what our typical model suggests.
Other Notable Black Swans
Besides Black Monday, there are other notable black swan events. For some, their effects may be more constrained to certain asset classes or markets.
2015 Currency Shock – Swiss Central Bank Scrapped Franc’s Peg to Euro
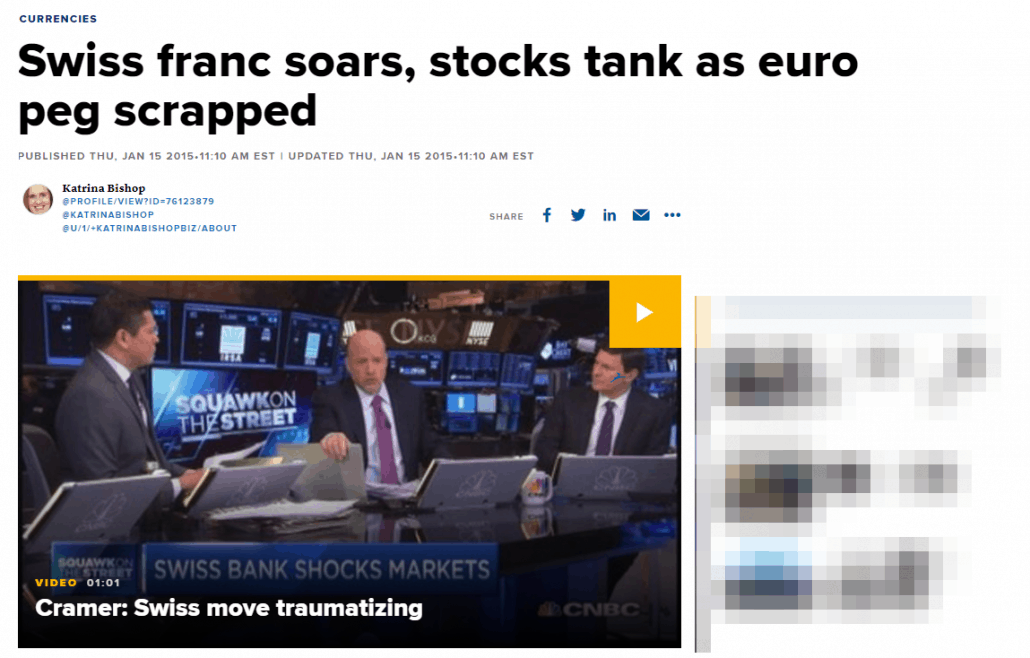
On 15 January 2015, Swiss National Bank (SNB) suddenly abolish its peg of 1.20 swiss francs against the euro. That sent a massive shock wave across the currency markets. Swiss francs jumped more than 30% against the Euro at one point before easing some of its gains. This is one classic example of how a perceived low risk trade transformed into a fearsome black swan due to an unexpected policy decision.
FX trades are among the most highly leveraged. Some FX brokers offered leverage as high as 400 times what retail clients had in their accounts. All is well until disaster strikes. Those on the winning side made enormous gains. But those on the opposite side of the trade had their worst nightmares. Many accounts were wiped out in an instant. Unable to shoulder losses from clients that were unable to pay up, FX brokers like Alpari and Global Brokers went into insolvency. Even professional funds were not spared. Everest Capital, a veteran hedge fund manager, had to close its $830 million Global Fund after having most of its assets erased.

Visual look at the EURCHF’s move on the day swiss franc was unpegged to the euro
2016 Brexit – Fear of Contagion to EU

On 23 June 2016, United Kingdom (UK) held a referendum to determine whether they should stay in or leave the European Union (EU). And the referendum result – UK voted to leave. Anyway, it is a complicated process and matters are still being sorted out at this point. But what is the big fuss about one nation leaving the 28-member EU? The implication is never just on UK alone. Markets fear Brexit will trigger a contagion that leads to more members leaving the EU amidst growing tensions and divides. EU is one of the largest economy and many member states shared a unified currency – euro. A wider EU breakup can have tremendous repercussions.
The fear was amply felt in the markets. The front month VIX futures moved violently. It rocketed up more than 60% from its prior close during Asian hours following Brexit. Global stock markets pulled back sharply over 2 days. US S&P 500 is down more than 5%. Europe, which is at the center of the storm, fared much worse. Germany DAX and France CAC sank almost 10% while Spain IBEX nosedived 14%. These 2-day moves from 24-25 Jun 2016 were in stark contrast against how the market had been behaving before the vote took place. Prior to it, markets complacently discounted the possibility of a UK departure. Although a sharp recovery followed thereafter, many markets closed in the red for the month.

Table showing the performance of the stock markets during Brexit and the month of June 2016

1-day move of the front month VIX futures contract during Brexit

Pre and Post Brexit Stock Markets
2018 Vol-mageddon – Demise of the XIV ETN

For those who traded through February in 2018, the events that unfolded should still be firmly etched into your mind.
Before this, global stock markets had one of their best runs in 2017 riding on the back of record-low volatility. The party continued into 2018 with markets staging a euphoric rise that sees new record highs in January. But all good things eventually come to an end.
A strong labour report in February sparked renewed fears in faster interest rate hikes. A massive sell-off across all asset classes ensued over the next few days, leading to an unprecedented surge in volatility. This caused an aftermarket squeeze where inverse volatility ETNs rushed to cover their shorts exacerbating the situation.
On 5 Feb 2018, VIX surged over a 100%, and the largest inverse volatility ETN – XIV, collapsed, trading more than 90% below its prior close. To fully appreciate the enormity of the event, XIV rose more than 1400% since its inception in 2010 over a period of more than 7 years. And in a matter of a few days, all these gains were wiped out and more.
The markets dealt a severe blow to many funds. LJM Partners, which managed more than half a billion-dollar in assets, shuts down after losing more than 80% for the month. At the back of their minds, I assume professional asset managers are cognizant of the possibility of such an event. But as always, being aware is one thing, and what you do about it is another.

Vix Index spiked more than 100% on 5 Feb 2018

Fighting The Swans
Conventional risk measures are sorely inadequate to address tail risks from black swan events.
Unfortunately, we have no other means to quantify such risks at the moment.
From a statistical point of view, there is just insufficient data to make any sense out of it. But that does not mean we should ignore it, or are entirely defenceless against it.
There may be no foolproof way to eradicate such risks, but as always, we can take steps to mitigate the impact should we run into one. Here are a few general ideas.
#1 – Understanding your strategies and knowing your black swans
Black swans can hit anyone, anywhere, anytime.
However, its impact varies for different people. It depends a lot on the person’s investment strategy and positioning. What is a black swan for you may turn out to be a windfall for some, and nothing more than a scratch for others.
For example, the currency shock in 2015 might have decimated those with large FX exposure on the wrong side of the trade.
But those not in FX space may hardly feel anything. The same goes for Vol-mageddon in February 2018.
If you are not directly shorting US volatility, say through VIX futures, ETNs or options, it may be nothing more than a market correction for you, albeit a rapid one.
As an investor, you should know the strengths and weaknesses of your strategies before you administer any “treatment”. This is to make sure you are guarding against the right swan.
[Editor; In boxing, they have a saying. Chin down, guard up, and watch your ribs. This is similar in that regard. Always watch for how your investments can rapidly self-destruct and guard against it. That is why I try to kill a company/investment idea in my head before I make a decision. Although sadly, this leaves me with very little to invest in.]
#2 – Diversification is your first line of Defence
Diversification is your first line of defence in mitigating fallouts from drastic events.
There are traders that think otherwise. They believe that they can navigate out of any crisis and prefer taking concentrated bets.
Diversification, they feel, involves no skills and dilutes the returns.
In addition, it tends to fail when you need it most as everything gets more correlated during a crisis.
Their concerns are not unfounded. But taking concentrated bets only expose you to an even higher risk of tail loss.
With each bet capable of costing you dearly during such a scenario, you have almost zero room for mistakes. So to rely solely on “skills” to tackle unpredictable black swan occurrences, while commendable as a brave effort, leave your fate very much in the hands of luck.
To be clear, we are not talking about run of the mill diversification where you just spread your bets across a few more stocks. That only help in a stock-specific black swan.
For example, one of the companies you held was discovered to commit serious fraud in cooking its financial numbers. And as a result, its share price plummets.
Spreading your bets among more companies here helps to isolate the impact to that particular stock. But it will provide you with little protection against more extensive events like Black Monday.
When it comes to the crunch, stocks all head the same way.
We need a more robust and holistic approach that involves different asset classes, strategies and time frames.
#3 Diversification Across Asset Classes
Different assets classes, while linked in one way or another, have their own dynamics. Their lower correlations with each other make them useful for diversification. For instance, a stock market crash can lead to funds flowing into safe-haven assets like bonds and gold. So while the former decline, the latter may buffer some of these losses.
The diagram below shows how the S&P 500 ETF and the 20+ Yr Treasury bond ETF move since 2002. Over the long term, both have appreciated but their paths are markedly different. During critical periods such as the 2008 subprime meltdown and a few other sharp corrections, both head in the opposite directions. Their 60 day rolling correlations is negative most the of time, and ranges from around -0.8 to +0.4. A simple composite portfolio comprising 50% SPY and 50% TLT rebalanced daily produce decent results. It has the lowest volatility and one day loss among all 3.

NAV of SPY vs TLT and their rolling 60-day correlations

But note that asset diversification is fully capable of failing as well when you need it. Correlation risks are its Achilles heel.
A lot hinges on what is driving the market at the moment.
You can see for yourself from the chart that correlations are not a static number. It changes.
For instance, an unexpected tightening regime can send both bonds and equities tumbling over a period, driving up their correlations. A strengthening USD in a rising rates environment can also exert downward pressure on commodities like oil and gold.
Strategies and Time Frames
Besides asset classes, we can also diversify across different strategies and time frames. Every single strategy has its own drawbacks.
- A trend-based strategy can be heavily whipsawed in wild market swings. A counter-trend, on the other hand, can be caught sizing up on the wrong side of a tsunami.
- Spread based or market neutral strategies, that typically apply high leverage, run the risk of huge losses in the event of extreme divergence.
- Naked option selling strategies look good until the “bomb” explodes and you end up losing much more than the premium you collect.
There is no perfect strategy, but they can complement each other and reduce the impact of tail risks from any single one. A calibrated blend of lowly correlated and profitable strategies can make your portfolio much more robust than one using a single concentrated strategy.
#3- Asymmetric hedge: fighting a Swan with a Swan
Hedging is another useful defence.
But you need a hedge with a swan-like or asymmetric payoff. One that pays you big time when a black swan hits you. Volatility products such as VIX futures, long volatility ETNs, and options are possible candidates. But of course, such protections do not come for free.
Over the long haul, they will impose a drag on your portfolio and you may never recoup all that has been sunk in.
However, it is important to know what it means to hedge. When you hedge, you are not aiming for profit, you are paying for protection against the possibility of sudden financial ruin.
For professionals running a fund, you will be able to appreciate the importance.
Black swans are events that will pull the tide back and reveal who has actually been swimming naked. Being down 20% in a day or month is a whole world of difference against being down 20% in a year. It says a lot about the real risks behind your portfolio and approach.
Conclusion
Black swan events are a reminder that we all live in the real world, not a theoretical one.
Modern science and math may have come a long way in helping us understand the markets. But many things remain out of reach for the lack of deterministic data. We would love to have thousands of well documented black swan events for our analysis. However, we know that is not going to happen.
This will remain one of the many uncertainties that all investors have to grapple with. A prudent investor should be mindful of that and temper his approach with a good dose of “common sense”.
If there is one statement about the market everyone should take away here, it is “Never say it will not happen”. Because if you are in the market for the long haul, the Black Swan will pay you a visit one day.