Techtronic Industries is a power tool company that gives investors a bang for their buck. Let’s look at how the company has grown over the years, the long-term industry prospects for power tools and benchmark the group against close competitors.
Introduction
Recall the time you had to assemble a piece of furniture that you bought from IKEA or were tasked to fix up a section of the house? Imagine having to manually hammer in a nail or to screw in a nut and bolt – that would have made the job tedious and inefficient. Enter electronic equipment such as power tools and hand drills, and suddenly the job gets done much faster and without too much effort!
Introducing Techtronic Industries Co Ltd (SEHK: 669), or TTI for short. The group is a world leader in power tools, hand accessories and hand tools. It also manufactures floor care equipment and appliances and serves the home improvement, repair and maintenance and construction industries. TTI has well-known brands such as Milwaukee, Ryobi and Hoover, and the group continually invests in research and development (R&D) to come up with new products to better serve its customer base.
Let’s take a deeper dive into TTI to assess the strengths and merits of this company, while also looking at some risks involving the business, its competitors within the sector and the prospects for the power tools industry.
Steady Growth
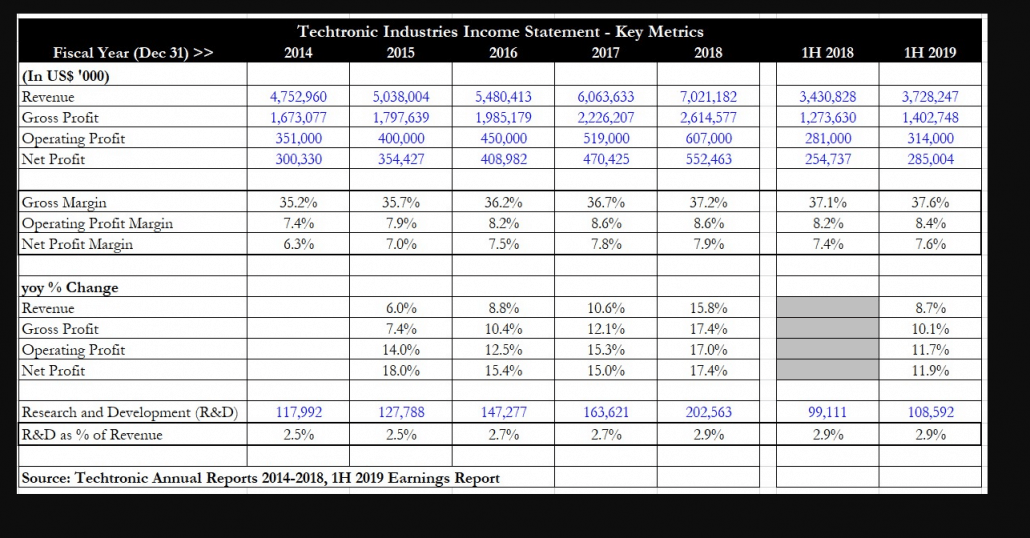
Looking at the five-year growth profile for TTI, it can be seen that revenue has steadily climbed from 2014-2018, rising from US$4.7 billion to US$7 billion. For H1 2019, revenue continues to climb, up 8.7% year-on-year to US$3.7 billion. As we will see later, the jump in revenue is mainly contributed by the group’s key power tools division.
Gross and operating profit have also climbed in tandem with revenue. TTI demonstrates good cost control, and this allows increases in revenue to flow straight down through to its operating profit (EBIT) and bottom line. Net profit almost doubled over the last five years, rising from US$300 million to US$552.4 million. This growth looks set to continue with H1 2019 seeing an 11.9% year-on-year rise in net profit. Investors should note that the increase in operating and net profit is higher than that of revenue, a sign that positive operating leverage is kicking in.
Consistently improving gross margins
The group has reported improved gross margins for the eleventh consecutive first-half, a remarkable feat indeed as it demonstrates TTI’s strong pricing power. Gross margin started off at 35.2% in FY 2014 and rose steadily to 37.2% in FY 2018. For H1 2019, gross margin continued to improve to 37.6% as the group continues to focus on cost control and also due to new product introduction, favourable product mix, operational efficiency and supply chain productivity. Though the US-China trade war has resulted in additional tariffs being implemented on a variety of goods, TTI has managed to mitigate the impact of these tariffs, thus preserving margins.
Free cash flow

TTI also has a history of consistent free cash flow (FCF) generation. From FY 2014 to FY 2018, the group has generated positive operating cash flow. Capital expenditure (capex) has ranged between the U$200 million to US$400 million levels, but investors need to watch out for FY 2019 as H1 2019 showed negative operating cash flow and also negative free cash flow. This was partly due to TTI relocating1 its Floor Care Division outsourcing from Suzhou to Taiwan in order to avoid the 25% US tariffs. If this is a one-off shift to avoid the tariffs arising from the trade war, then the negative FCF is explainable and acceptable.
Steadily increasing dividends

As a result of soaring net profit and healthy FCF, TTI has also been raising both its interim and final dividend year-on-year for the last five years. Total dividend nearly tripled from 4.05 US cents in FY 2014 to US 11.33 cents in FY 2018, and shareholders who held on to the company over the last five years were well-rewarded with 20-35% annual year-on-year increases in total dividends. This trend looks set to continue with H1 2019’s interim dividend rising by 18.4% year-on-year to US 5.79 cents.
Divisional Analysis

I’ve summarised TTI’s two key division’s segment performance over the last five years. A few clear trends can be noted here. The first is that power equipment division has seen consistent double-digit rises in revenue over the last 5 years, and has been the driver of overall revenue growth for the group. In fact, power equipment is taking up an increasing chunk of total revenue, from 85.6% in FY 2018 to 89.1% in H1 2019.
Floor care division’s revenue has been erratic over the years and displays no clear trend. It appears to be a secondary source of revenue for TTI rather than setting the pace for overall revenue growth. Segment profit-wise, power equipment division is clearly the star performer, with segment profit doubling from FY 2014 to FY 2018 (US$292 million to US$598.3 million). Segment margin for this division has also improved from 8.2% in FY 2014 to 10.0% in FY 2018, a clear sign that there is both pricing power and operating cost efficiency for this division.
Floor care division, on the other hand, delivered an increasingly lacklustre performance. Segment profit declined from US$58 million in FY 2014 to just US$9.2 million in FY 2018. H1 2019 saw an abysmal performance from this division as net profit shrivelled to just US$144 million. Segment margin went from a healthy 4.8% to become nearly non-existent.
Catalysts and R&D
An important catalyst for TTI is the development of high-margin new products in order to drive both revenue growth and further gross margin improvement. An example of this is high-performance cordless lighting tools. This is a form of category expansion and is gaining traction among customers.
Some of the newly launched products mentioned in H1 2019’s interim report includes the newly-launched Milwaukee mechanics hand tool line, Milwaukee Packout system and Milwaukee Stud tape measurers. These new products boast innovative features that improve upon older versions and provide customers with durability, efficiency and convenience.
An indication of TTI’s commitment to innovation lies in observing the group’s R&D expenses to revenue ratio. In FY 2014, R&D expenses made up 2.5% of revenue, but this had increased to 2.9% in FY 2018 and also H1 2019. The group’s commitment to R&D is what allows it to introduce new, innovative products to the market in order to engender client loyalty and win over new customers, thus strengthening its hold on the market.
Industry projected growth rate and prospects
The good news is that the power tools market is projected to grow2 at a compound annual growth rate (CAGR) of 5.5% from 2019 to 2024. This growth will be driven by the increased adoption of cordless power tools (i.e. convenience factor) and rising demand for fastening tools as a result of a boom in construction industries in many emerging economies. Power tools are being increasingly viewed as advanced tools, and are highly sought after by consumers due to their ergonomic features and lightweight.
There are three trends3 driving the growth in the power tools market. One is the shift from corded to cordless, as this demonstrates the desire for more mobile tools. Battery-operated tools such as saws and drills are becoming increasingly popular. The second trend is that of lithium-ion batteries replacing the old nickel-cadmium batteries, as these batteries are smaller and more lightweight. Lithium-ion also packs a higher energy density that allows the battery to draw more current and work longer. Finally, as mentioned previously, the slew of new product developments from players in the industry is driving rapid and sustained growth in the industry.
Competitors
TTI has a few major competitors in the same power equipment space. I have selected two listed competitors in order to compare financial and valuation metrics against TTI. The first is Stanley Black and Decker, Inc (NYSE: SWK). Black and Decker is an American manufacturer of hand tools, power tools and related accessories. The group also manufactures automatic doors and commercial locking systems.
Another competitor is Japan’s Makita Corporation (TYO: 6586). The group was founded in 1938 and is a manufacturer of electric power tools, gardening equipment, pneumatic tools and household equipment.

From the above table, it can be seen that TTI has the highest gross margins among the three companies. However, its operating and net profit margin are lower than those of Makita. Stanley Black and Decker has the lowest net margin, possibly because it has other divisions in addition to power equipment that may not boast high net margins.
When looking at growth, though, it’s obvious that TTI is the most impressive. Year-on-year growth in both revenue and net profit was in the double-digits for TTI, while Makita only managed to eke out a tiny year-on-year increase in both. Black and Decker was the worst of the three, reporting a year-on-year increase in revenue while profit plunged by half. In terms of dividend yield, TTI has the lowest of the three at 1.6% but the difference in dividend yield was not significant.
Valuation-wise, TTI is trading at a rather high price-earnings ratio of 24.7x, but this seems justified as it has the highest growth margins and also best growth potential among the three. Makita trades at a justifiably lower valuation as it has reported a low single-digit increase in net profit. Price-to-book is displayed here but I feel it’s not as important as price-earnings is the most indicative valuation metric for companies in this sector.
Risks to the business
The main risk to the power equipment business would be an economic downturn, as this would crimp consumers’ spending ability and make them unable and unwilling to commit to purchases of new and improved products. Another risk is that of a sector downturn in the construction industry, as TTI sells its power tools mainly to this sector. However, the group has only a small net debt balance of US$218 million, and with the consistent FCF it generates, this should mitigate the risk of a protracted downturn.
TTI has also shown that it is able to continue to invest in R&D to innovate its products, thereby maintaining its market lead. This is a mitigating factor when it comes to risks, as people are more likely to continue buying from a trusted and reputable manufacturer with strong brand equity and recognition during tough times, rather than smaller, less well-known ones.
Valuation and conclusion
To summarise, TTI has maintained a stellar track record of growth over the years and has also increased its dividend significantly to reward shareholders. Though valuation may seem expensive at around 25x earnings, I believe investors should pay up for a quality company. TTI has industry-leading gross margins that are still improving, while revenue and net profit continue to display double-digit improvements. Prospects for the power tools industry remain sanguine and barring any unforeseen circumstances, it looks as though TTI should be able to enjoy many more years of growth.
- http://www.aastocks.com/en/stocks/news/aafn-con/NOW.958672/research-report↩
- https://www.prnewswire.com/news-releases/41-7-bn-power-tools-market—global-forecast-to-2024-leading-manufacturers-are-stanley-black–decker-bosch-makita-hilti-and-techtronic-industries-300910500.html↩
- https://www.grainger.com/content/supplylink-trends-drilling-the-power-tools-market↩
Editor’s Notes: This is one of those stocks that always leave me scratching my head. I like buying cheap. I like buying cheap so much I know I’m probably biased as hell. Having said that, even earnings growth valuations exist to help cheap asses like me decided whether to buy or not. A quick word – when I can’t tell if the business is going to do well, I move on to another. There’s nothing wrong with passing on what seems like a perfectly good opportunity when you don’t know what you are getting into.
I’ve pasted the screenshots of some information from our proprietary screener down below so you might be able to make a more informed decision. In particular, there are some questions I want readers to think through. Consider this homework.
1) Can techtronic raise prices without fear?
Pricing power tells you if a company has a real market and services that are needed. If I asked tomorrow to have $10 per kilowatt of energy, you could pay up or freeze in the winter or melt in the Singapore heat. But if I asked you to pay 100% more for a power tool – would you? I don’t think so. There’s a limit here to how much you can push the price of a product before price elasticity here snaps back and gets in your face. As Royston has rightly pointed out, R&D will be needed to drive more effiecient, and higher margin products. No one can guess at the likelihood of that. Not even the R&D team. Not the sales team. Certainly not the CEO. I’d chock this question as a no and move on, but feel free to engage in a bit of thinking and tell me if I’m wrong.
2) Do they have a large and increasing market to sell their goods to?
What is the evidence? Research some amount of statistics in China on power tools usage and see what the take up rate and lifecycle of a customer is like, get a rough conservative value, then apply it to China’s larger population. there’s alot of guesswork here, so I’ll recommend you be extra conservative. You want to be roughly right not precisely wrong here.
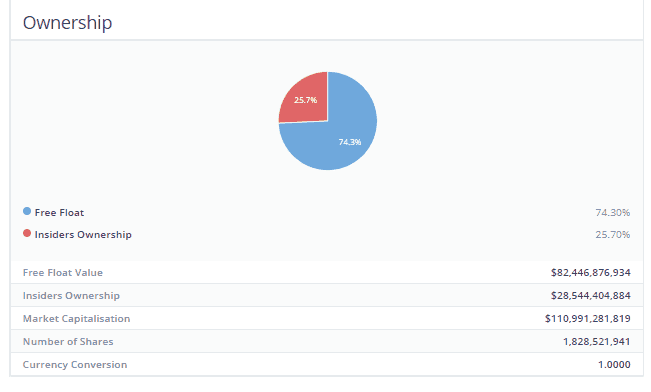
3) management seems to own a good amount of shares.
check if they have bought back any recently or sold any. Look at the founder. Look at whether the company has been able to materialise intangible value. more importantly, go back through ten years of annual reports and glimpse through what management have said they would do – has it materialised as they said? or has all of it faded to obscurity? outline objectives stated in annual report methodically and you should be able to conclude if management is truthful enough with shareholders.
4) How will the company do in a recession?
Make a rough guess by drawing comparative data from other similar competitors who existed throughout the 07-08 recession. there was a drop in share price for techtronics from HKD$7+ to HKD$2+. Why? What caused this? Was it irrational reactions from the market due to the housing bubble crisis or did sales volume dry up killing profits for techtronic industries? Are you ready to take that risk? what’s the burn rate for the company and can they sustain a 5 year recession? a 10 year recession? or will they close up shop? power tools arent all necessary and needed devices. and a team of 10 guys can share 2-4 just as easily just as a family only needs one. How long can techtronic stay solvent versus a depressed economy?
Food for thought. Screenshots below have been taken from the screener available only to students of the Intelligent Investor Immersive. If you’d like to find out more about it, you can find that out here.